Graphic organizers are a visual and graphic display that sows the relationships between facts, terms, and or ideas within a learning task. They are often used for organizing content and ideas, and facilitating learners’ compression of newly acquired information. All students and learners, at any level or age, can benefit from the use of graphic organizers. Because graphic organizers present the material through visuals, they help students make meaning from what they are leaning in class. Graphic organizers can help you keep track of what you are reading and learning.
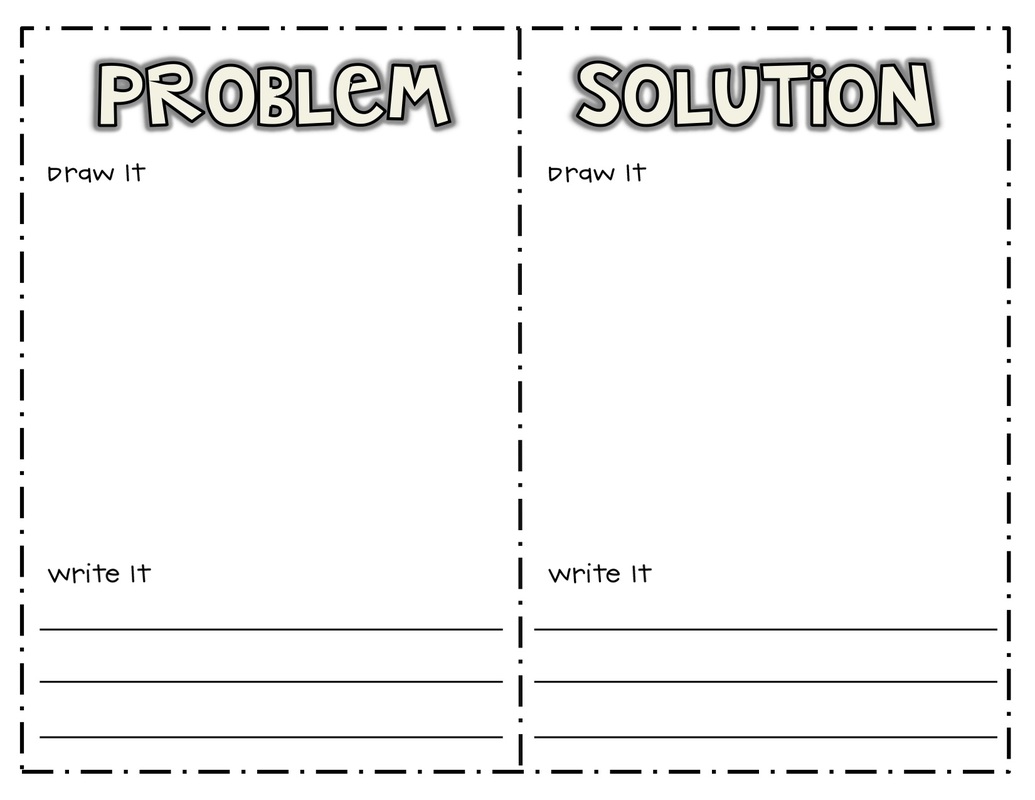
There are so many different types and uses of graphic organizers. In order to choose which graphic organizer to use, you must first identify your purpose for reading. Timelines can help you remember important details and events. A Web can help you keep related details and ideas together. A K-W-L Chart helps you connect information you are learning with questions you may still have after reading. A Cause and Effect Organizer helps you see the connection of why and what has happened. A Problem and Solution Organizer can help you see the connections in the story.
An additional benefit of graphic organizers is that you can differentiate them based on your student ability, and/or the task at hand. Graphic organizers can be completed with words or phrases, or pictures to demonstrate understanding of a text or concept.
A challenge of graphic organizers is that you mostly have to explicitly teach how to fill out the graphic organizer to younger students. Most often, children will not be able to infer how to use a graphic organizer properly, without instruction on how to do so.
In teaching this strategy, best practice is to model. Teachers should model how to use a new graphic organizer with a familiar text or concept. Graphic organizers can be used across the curriculum. With repeated practice, students should be able to choose and make his/her own graphic organizer.